Linear Equations in Two Variables
To graph an equation of the form y=mx+b
Any equation of the form , where m and b are constants is a linear equation in
two variables (y and x). The graph is a straight line.
Examples of linear equations:

Note: To be a linear equation the exponent on each
variable (y and x) must be the first power (exponent of 1).
To graph a linear equation:
(1) Choose some values for x and then find the corresponding values for y.
(2) Next plot these points on your graph
(3) Connect the points with a straight line.
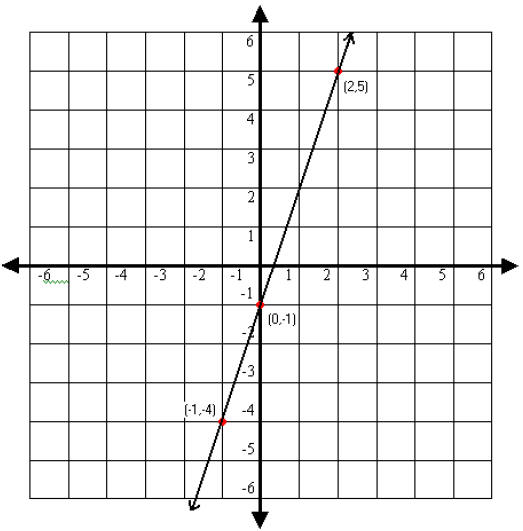
Example: Graph y=3x−1
First, we must find some points by choosing values for x
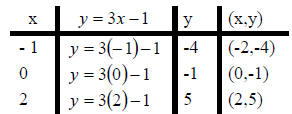
Next, we will plot these points and draw our line
To graph an equation of the form Ax+By=C
The equation Ax+By=C , where A, B, and C are constants is also a linear equation
because the exponents for x and y are the first power (1). Ax + By = C is known
as the standard form of a linear equation.
When trying to graph these equations, it is helpful to first solve the equation
for y. Once you have the equation solved for y, then you can follow the same
steps in graphing the equation as previously shown.
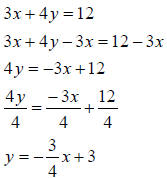
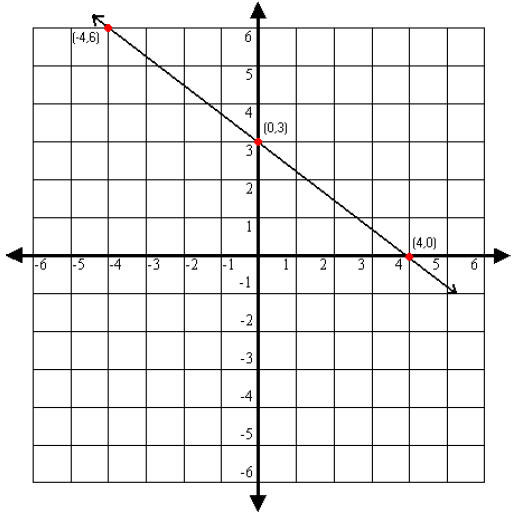
Example: Graph 3x+4y=12
The first step is to solve our equation for y.
 |
|
| First subtract “3x” from both sides | |
| Next divide each term by “4” | |
Now we can find points for the graph by choosing values for x and finding the
corresponding y value.
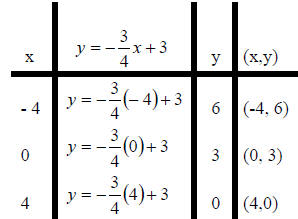
Now we can plot our points on the graph and draw our line.
The graph of a linear equation with one of the variables (x or y) missing is
either a horizontal line or a vertical line.
If “x” is missing, our equation will be a horizontal line in the form of y=b. This
is because no matter what value “x” is the value for “y” will always be “b”.
If “y” is missing, our equation will be a vertical line in the form of x=a . This is
because no matter what value “y” is the value for “x” will always be “a”.


