
Linear Equations and Inequalities
To solve an equation is to find the set of all real numbers that
when substituted for x in the equation, result in a true statement.
We call these numbers solutions or roots of the equation.
We say that these numbers satisfy the equation. The set of all
such numbers is called the solution set of the equation.
Linear Equations in One Variable
A linear equation in one variable x is an equation that can be written
in the form ax+b =0 where a and b are real numbers and a≠0.
Two equations are said to be equivalent if they have exactly
the same solution set.
The equation 5(x+8) =20x -(3x -4) and the equation x =3
each have the solution set {3}, but it is much easier to tell this
by looking at the latter than by looking at the former.
Our task is to transform former into the latter using transformations
that produce equivalent equations. Each step transforms the equation
on the left to an equivalent equation on the right.
Example 1 Solve 5(x+8) =20x -(3x -4) algebraically.
| Given Equation | Equivalent Equation | |
| 1. Simplify an expression by removing grouping symbols and combining like terms. |
 |
 |
| 2. Add (or subtract) the same real number or variable expression on both sides of the equation. |
 |
 |
| 3. Interchange the two sides of the equation. |
 |
 |
| 4. Multiply (or divide) both sides of the equation by the same nonzero quantity. |
 |
 |
Example 2 Solve the equation 
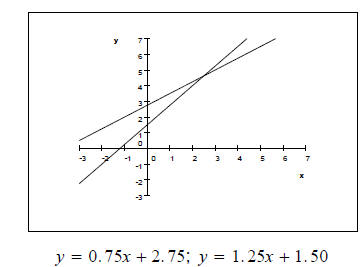
Example 3 Solve the equation 0.75x+2.75 =1.25x+1.50.
Graphical approaches to solving linear equations
| The Intersection-of-Graphs Method To solve the equation f(x) =g(x) graphically, graph y =f(x) and y =g(x) in the same viewing window. The x-coordinate of any point of intersection of the two |
| graphs is a solution to the equation. |
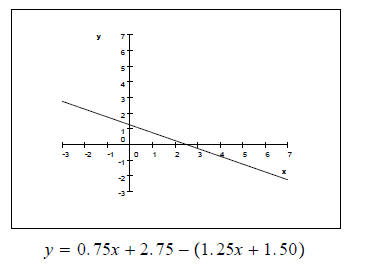
| The x–intercept Method To solve the equation f(x) =g(x) graphically, graph y =f(x) -g(x). The x-coordinate of any x-intercept of the graph is a solution to the equation. |
Example 4 Solve the equation 0.75x+2.75 =1.25x+1.50 using the indicated methods.
a. the intersection-of-graphs method
b. the x-intercept method.
An inequality is a statement with <,>,≤, or≥as
its verb.
To solve an inequality is to find all values of the variable
that make the inequality true. Each of these numbers is a
solution of the inequality, and the set of all such solutions
is its solution set. Since solution sets to inequalities tend
to be continuous intervals rather than discrete sets of points,
it is convenient to express these solution sets using a shorthand
notation, called interval notation, rather than graphing them
on the number line.
Example 5
Solve each inequality and express each solution set using interval notation.
A Graphical approach to solving linear inequalities
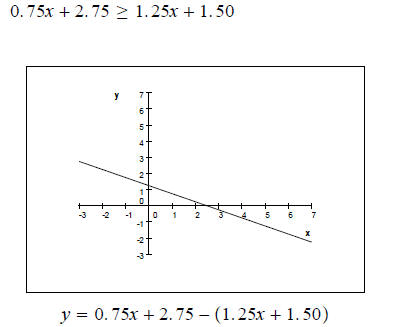
| The x–intercept Method To solve the inequality f(x)>g(x) graphically, rewrite it as f(x) - g(x)>0. The solution set to f(x) -g(x)>0 is the set of all real numbers where the |
| graph of y =f(x) -g(x) is above the x-axis. The solution set to f(x) -g(x)<0 |
| is the set of all real numbers where the graph of y =f(x) -g(x) is below the x-axis. |
Example 6 Solve the following inequality graphically using the x-intercept method.
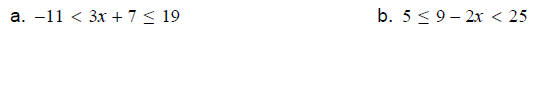
Three-Part Inequalities
Example 7 Solve each inequality and express each solution set using interval notation.